0%

prometheus监控golang

把prometheus和golang结合在一起,并监控golang的性能和接口状态。

1. golang的使用

1.1 基础的内置指标

  • 下载包
1
2
3
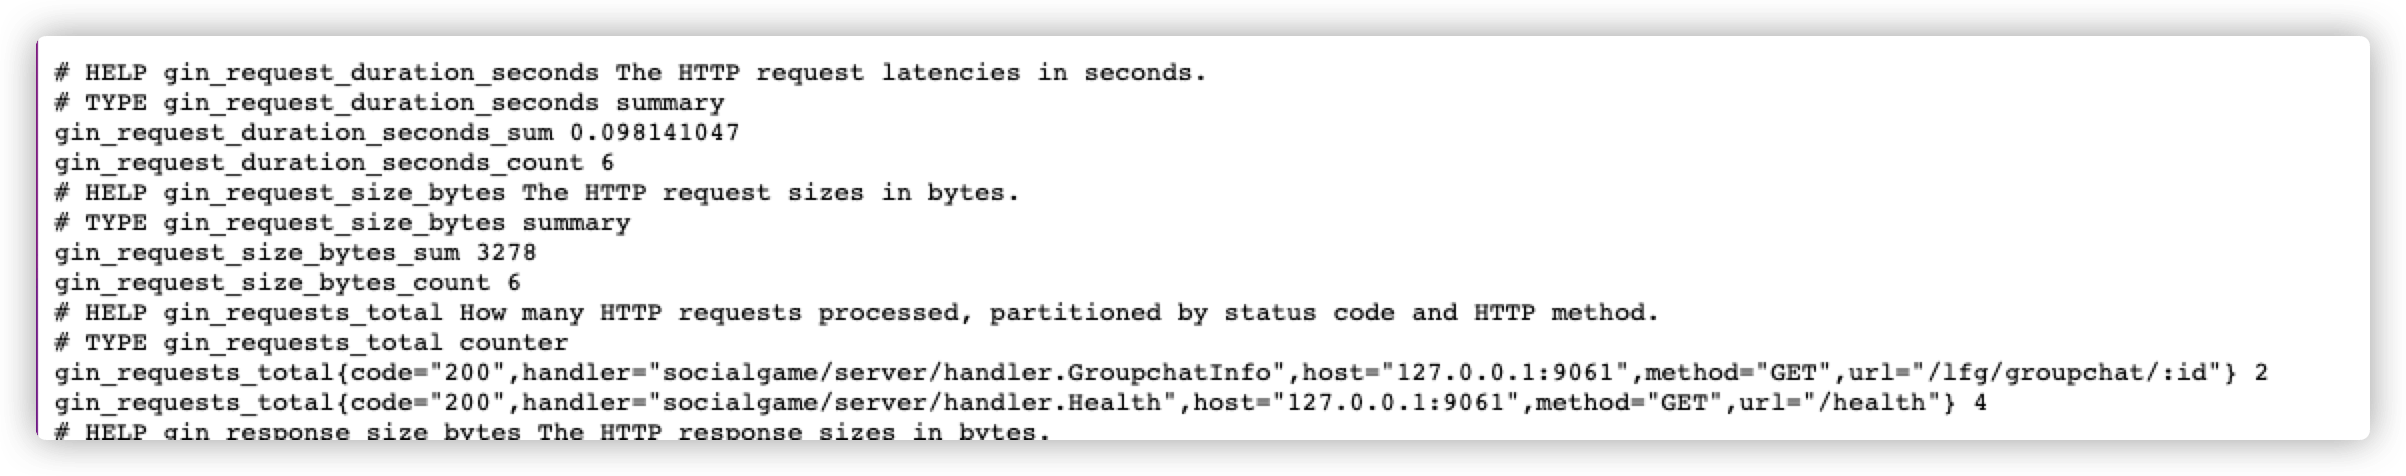
go get github.com/prometheus/client_golang/prometheus
go get github.com/prometheus/client_golang/prometheus/promauto
go get github.com/prometheus/client_golang/prometheus/promhttp
  • 代码注册
1
2
3
4
5
6
7
8
9
10
11
12
package main

import (
"net/http"

"github.com/prometheus/client_golang/prometheus/promhttp"
)

func main() {
http.Handle("/metrics", promhttp.Handler())
http.ListenAndServe(":2112", nil)
}
1
go run main.go
  • 访问获取信息
1
curl http://localhost:2112/metrics
  • 配置prometheus
1
sudo vi /opt/prometheus/prometheus.yml
1
2
3
4
- job_name: 'golang'
scrape_interval: 10s
static_configs:
- targets: ['127.0.0.1:2112']
1
sudo systemctl restart prometheus
  • 导入模板 6671
image-20220216174037473

1.2 gin 包装 prometheus

  • 下载包
1
go get github.com/zsais/go-gin-prometheus
  • 代码
1
2
3
4
5
6
7
8
9
10
11
12
13
14
15
16
// prometheus wrap
p := ginprometheus.NewPrometheus("gin")
p.ReqCntURLLabelMappingFn = func(c *gin.Context) string {
url := c.Request.URL.Path
for _, p := range c.Params {
if p.Key == "id" {
url = strings.Replace(url, p.Value, ":id", 1)
break
} else if p.Key == "short_link" {
url = strings.Replace(url, p.Value, ":short_link", 1)
break
}
}
return url
}
p.Use(appEngine)

注意这段代码尽量靠前放,在其他中间件之前。

  • 默认地址是/metrics

http://127.0.0.1:9061/metrics

image-20220217103251959

  • 模板
1
2
3
4
5
6
7
8
# 接口请求
gin_requests_total{job="golang"}
Legend: {{url}}


#错误码
promhttp_metric_handler_requests_total{job="golang", instance="127.0.0.1:9061"}
Legend:{{code}}
image-20220217142344934

1.3 另外一个库

https://github.com/penglongli/gin-metrics

2. 报警机制

2.1 Alert监控报警

  • 打开配置
1
2
3
4
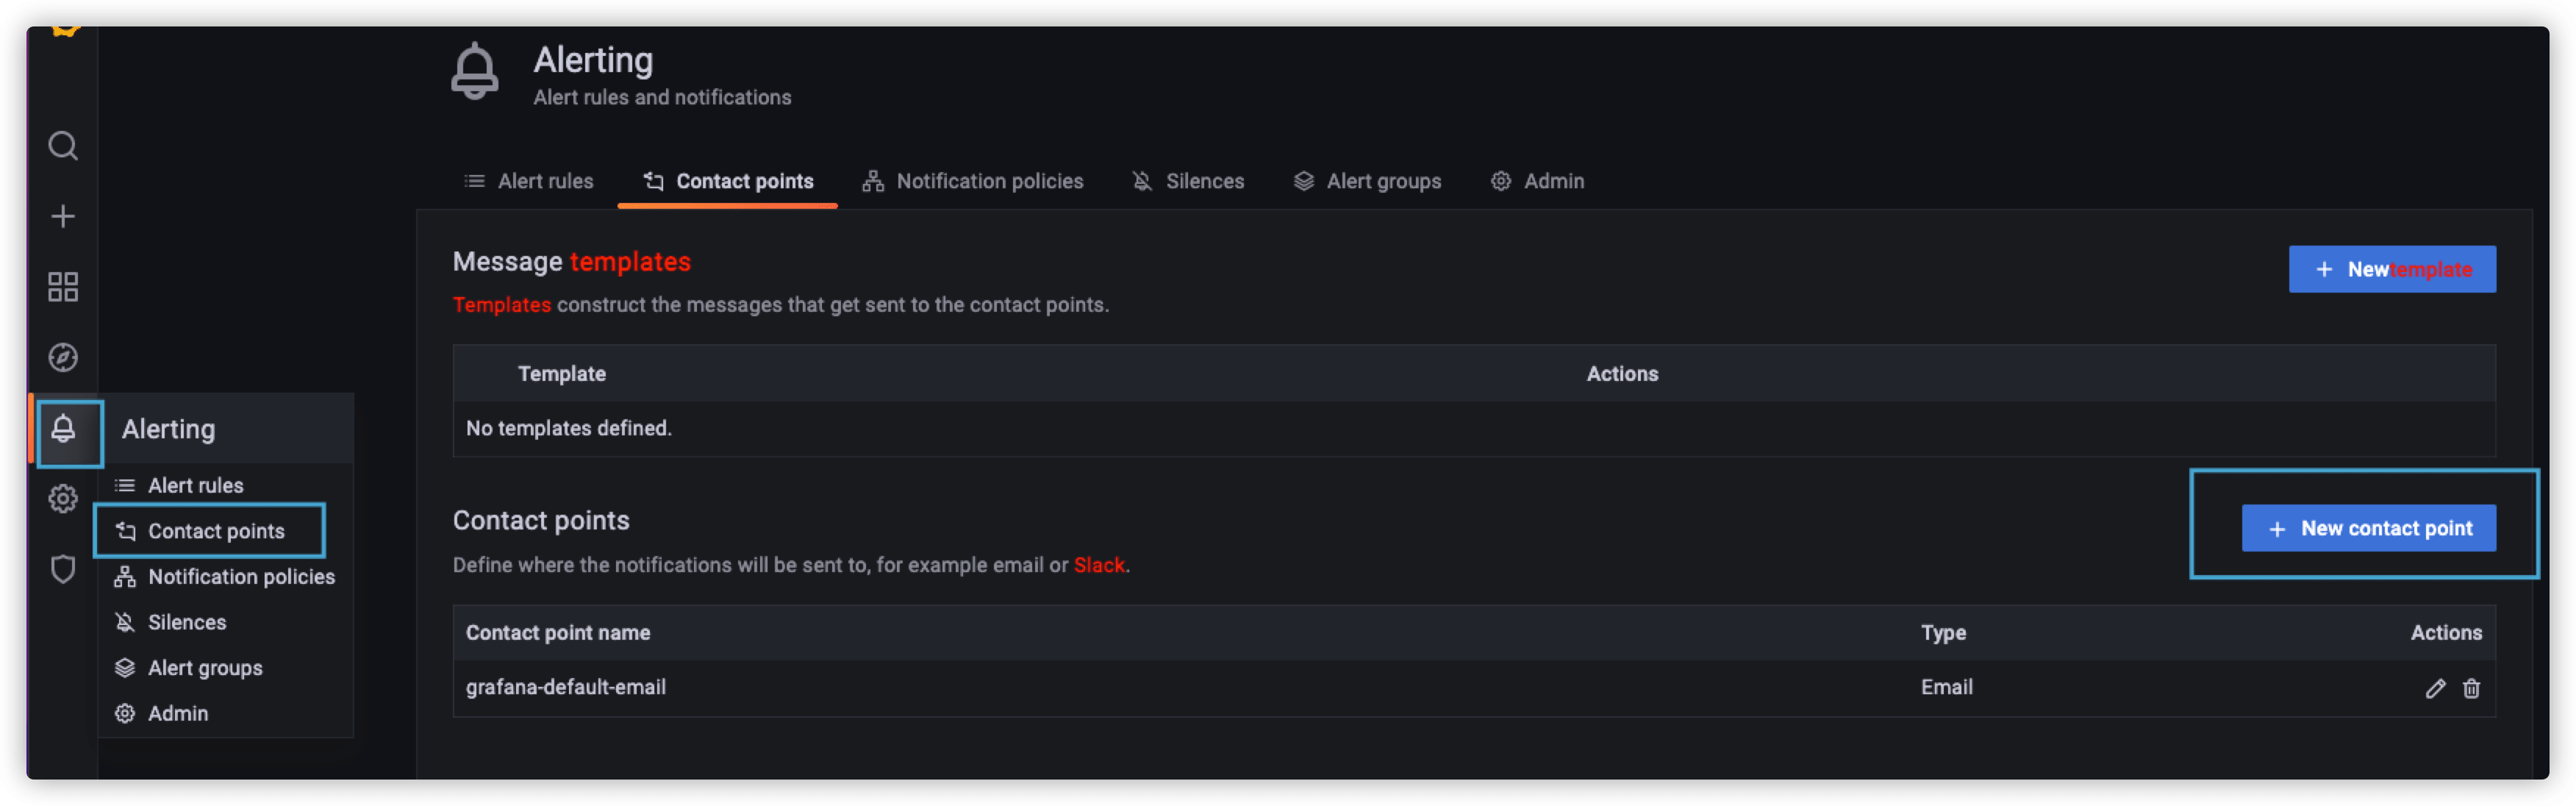
sudo vi /etc/grafana/grafana.ini 
#In your custom configuration file ($WORKING_DIR/conf/custom.ini), go to the unified alerts section. Set the enabled property to true.

sudo systemctl restart grafana-server.service
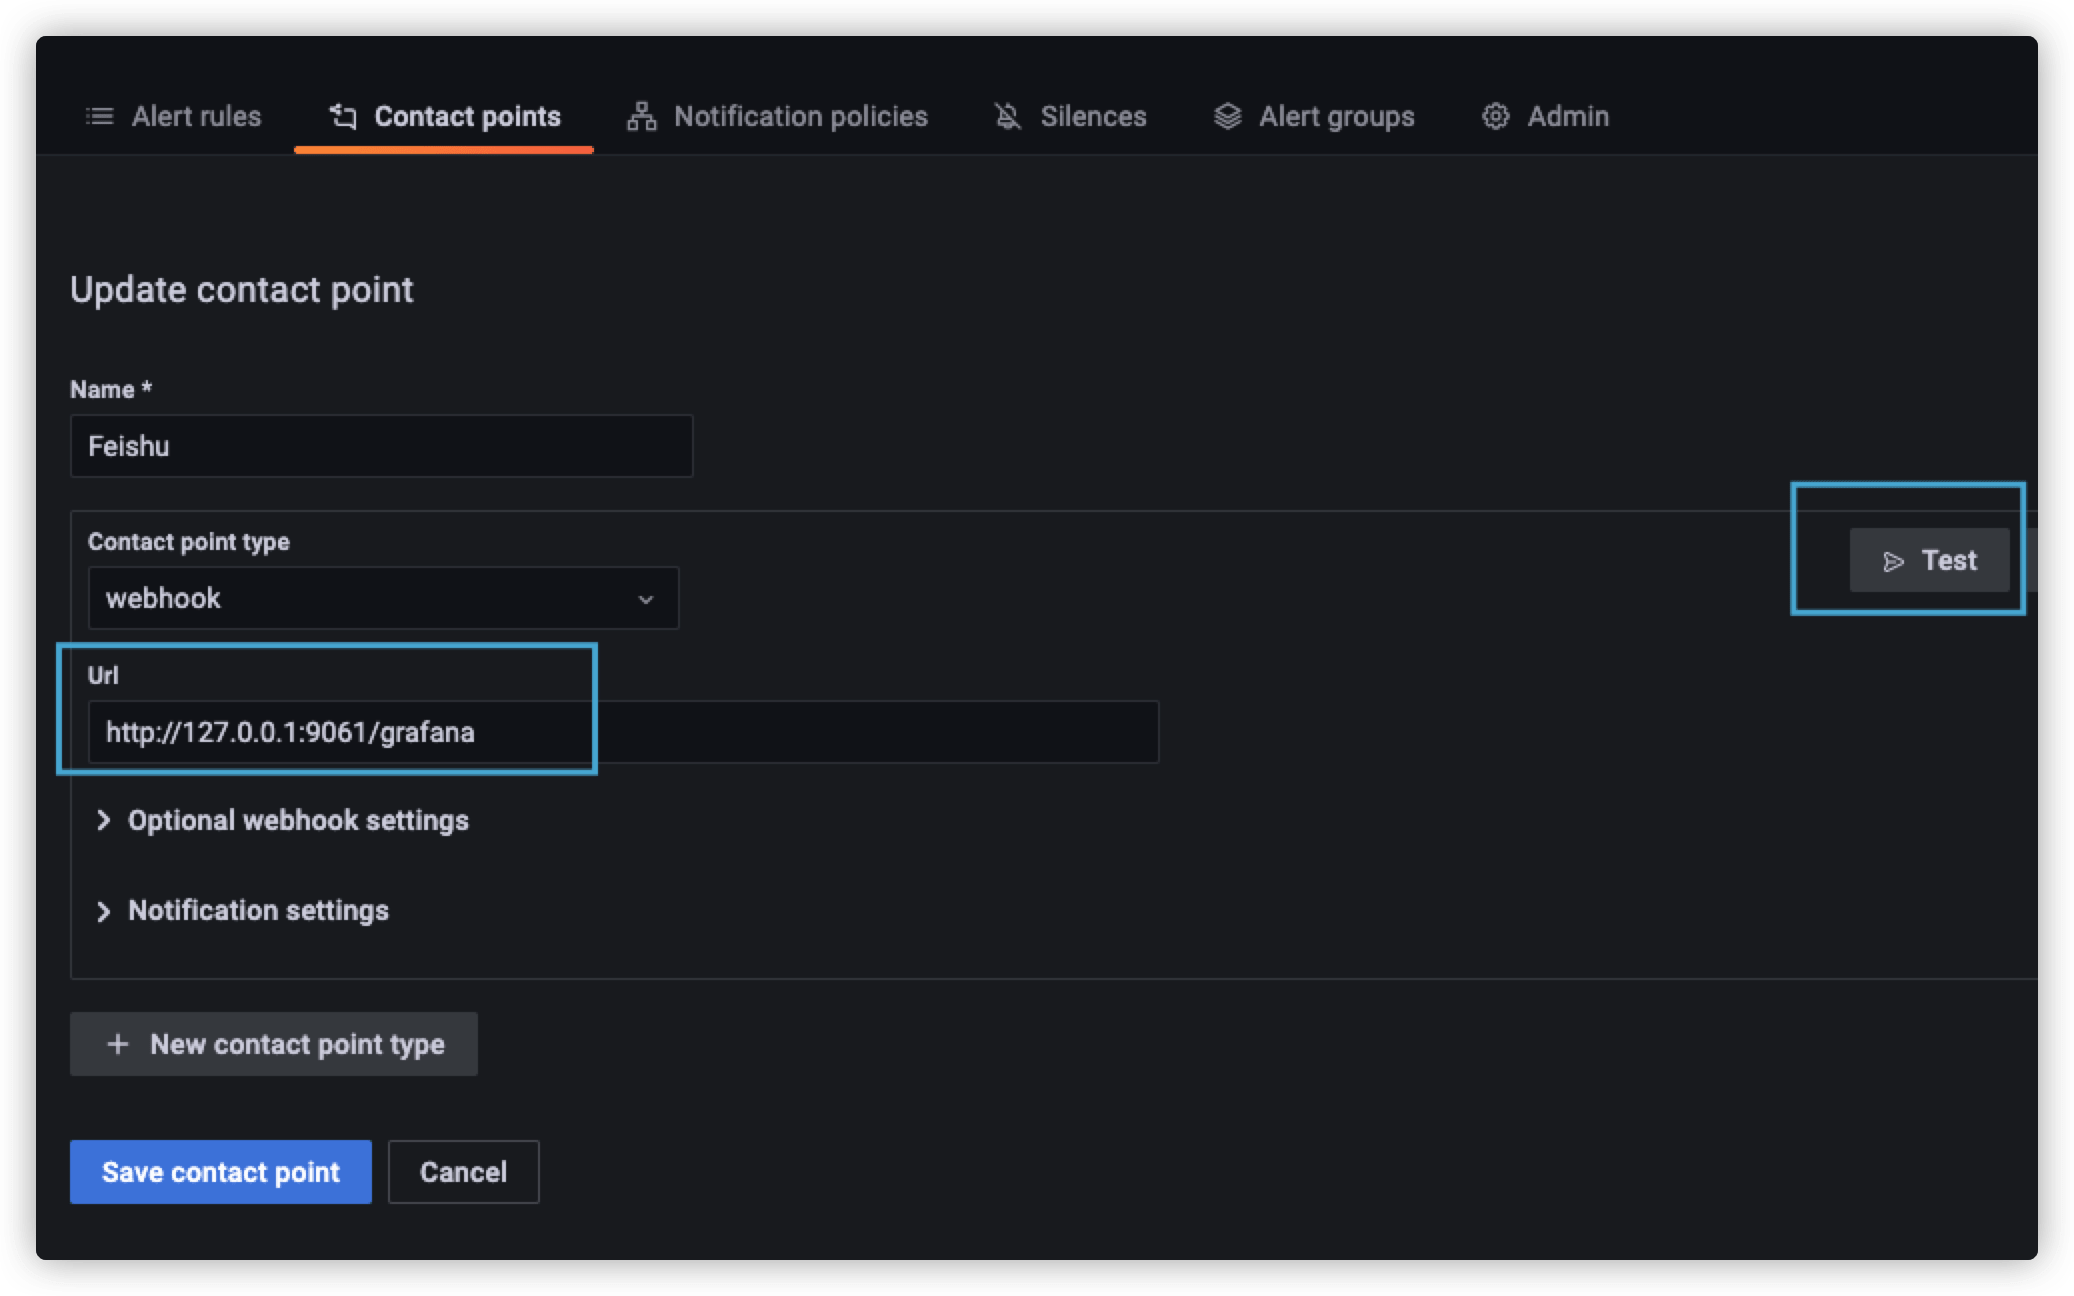
  • 新建报警API
image-20220217143522329

飞书不支持,自己用接口中转一下吧。
image-20220217151105605

  • 报警匹配规则image-20220217151737625

3. 遇到的问题

3.1 删除old jobs和instance

Expanding on evgenyl’s answer, the exact command would be something like:

1
curl -X POST -g 'http://localhost:9090/api/v1/admin/tsdb/delete_series?match[]={job="name_of_old_job"}'

Replace name_of_old_job with the name of the job you want deleted.

Reminder that you need to have started prometheus with the –web.enable-admin-api flag

1
2
curl -X POST -g 'http://localhost:9090/api/v1/admin/tsdb/delete_series?match[]={job="linux-node"}'
curl -X POST -g 'http://localhost:9090/api/v1/admin/tsdb/delete_series?match[]={instance="localhost:9100"}'

不过需要注意的是上面的 API 调用并不会立即删除数据,实际数据任然还存在磁盘上,会在后面进行数据清理。

4. 参考资料

可以加首页作者微信,咨询相关问题!