0%

prometheus的alertmanager使用

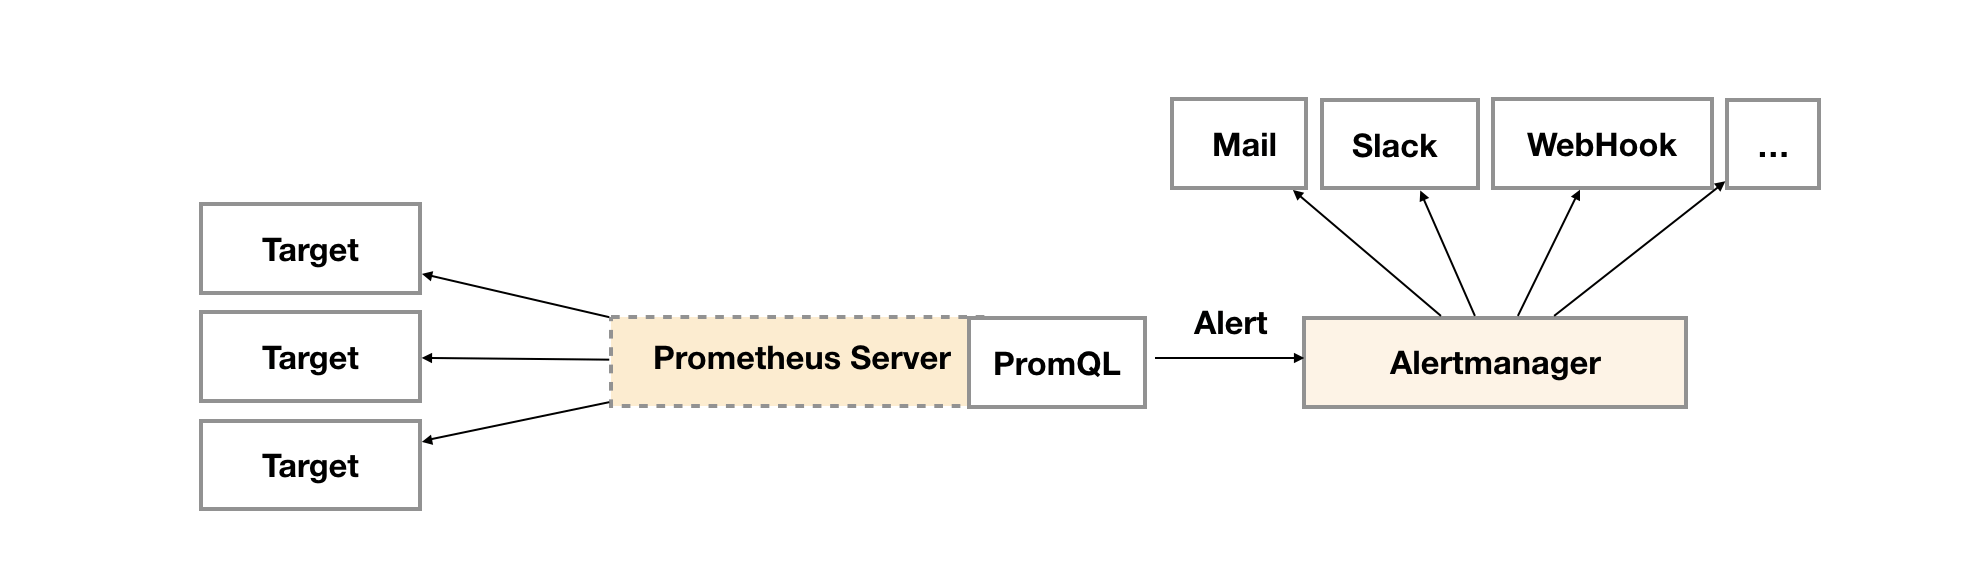
告警能力在Prometheus的架构中被划分成两个独立的部分通过在Prometheus中定义AlertRule(告警规则),Prometheus会周期性的对告警规则进行计算,如果满足告警触发条件就会向Alertmanager发送告警信息。

image-20220726115047660

1. 数据看板

教程: https://prometheus.io/docs/guides/node-exporter/

1.1 查看 metrics

查看target的metrics数据,如果是局域网,可以curl观看。

1
2
3
4
5
6
7
8
9
10
11
12
13
14
15
16
17
18
19
20
curl http://172.31.32.228:9100/metrics


# HELP go_gc_duration_seconds A summary of the pause duration of garbage collection cycles.
# TYPE go_gc_duration_seconds summary
go_gc_duration_seconds{quantile="0"} 3.6128e-05
go_gc_duration_seconds{quantile="0.25"} 7.7366e-05
go_gc_duration_seconds{quantile="0.5"} 0.000134775
go_gc_duration_seconds{quantile="0.75"} 0.000252918
go_gc_duration_seconds{quantile="1"} 0.014089749
go_gc_duration_seconds_sum 1298.146436301
go_gc_duration_seconds_count 3.161587e+06

# HELP node_filesystem_avail_bytes Filesystem space available to non-root users in bytes.
# TYPE node_filesystem_avail_bytes gauge
node_filesystem_avail_bytes{device="/dev/root",fstype="ext4",mountpoint="/"} 3.1182485504e+11
node_filesystem_avail_bytes{device="tmpfs",fstype="tmpfs",mountpoint="/run"} 1.657331712e+09
node_filesystem_avail_bytes{device="tmpfs",fstype="tmpfs",mountpoint="/run/lock"} 5.24288e+06
node_filesystem_avail_bytes{device="tmpfs",fstype="tmpfs",mountpoint="/run/snapd/ns"} 1.657331712e+09
# HELP node_filesystem_device_error Whether an error occurred while getting statistics for the given device.

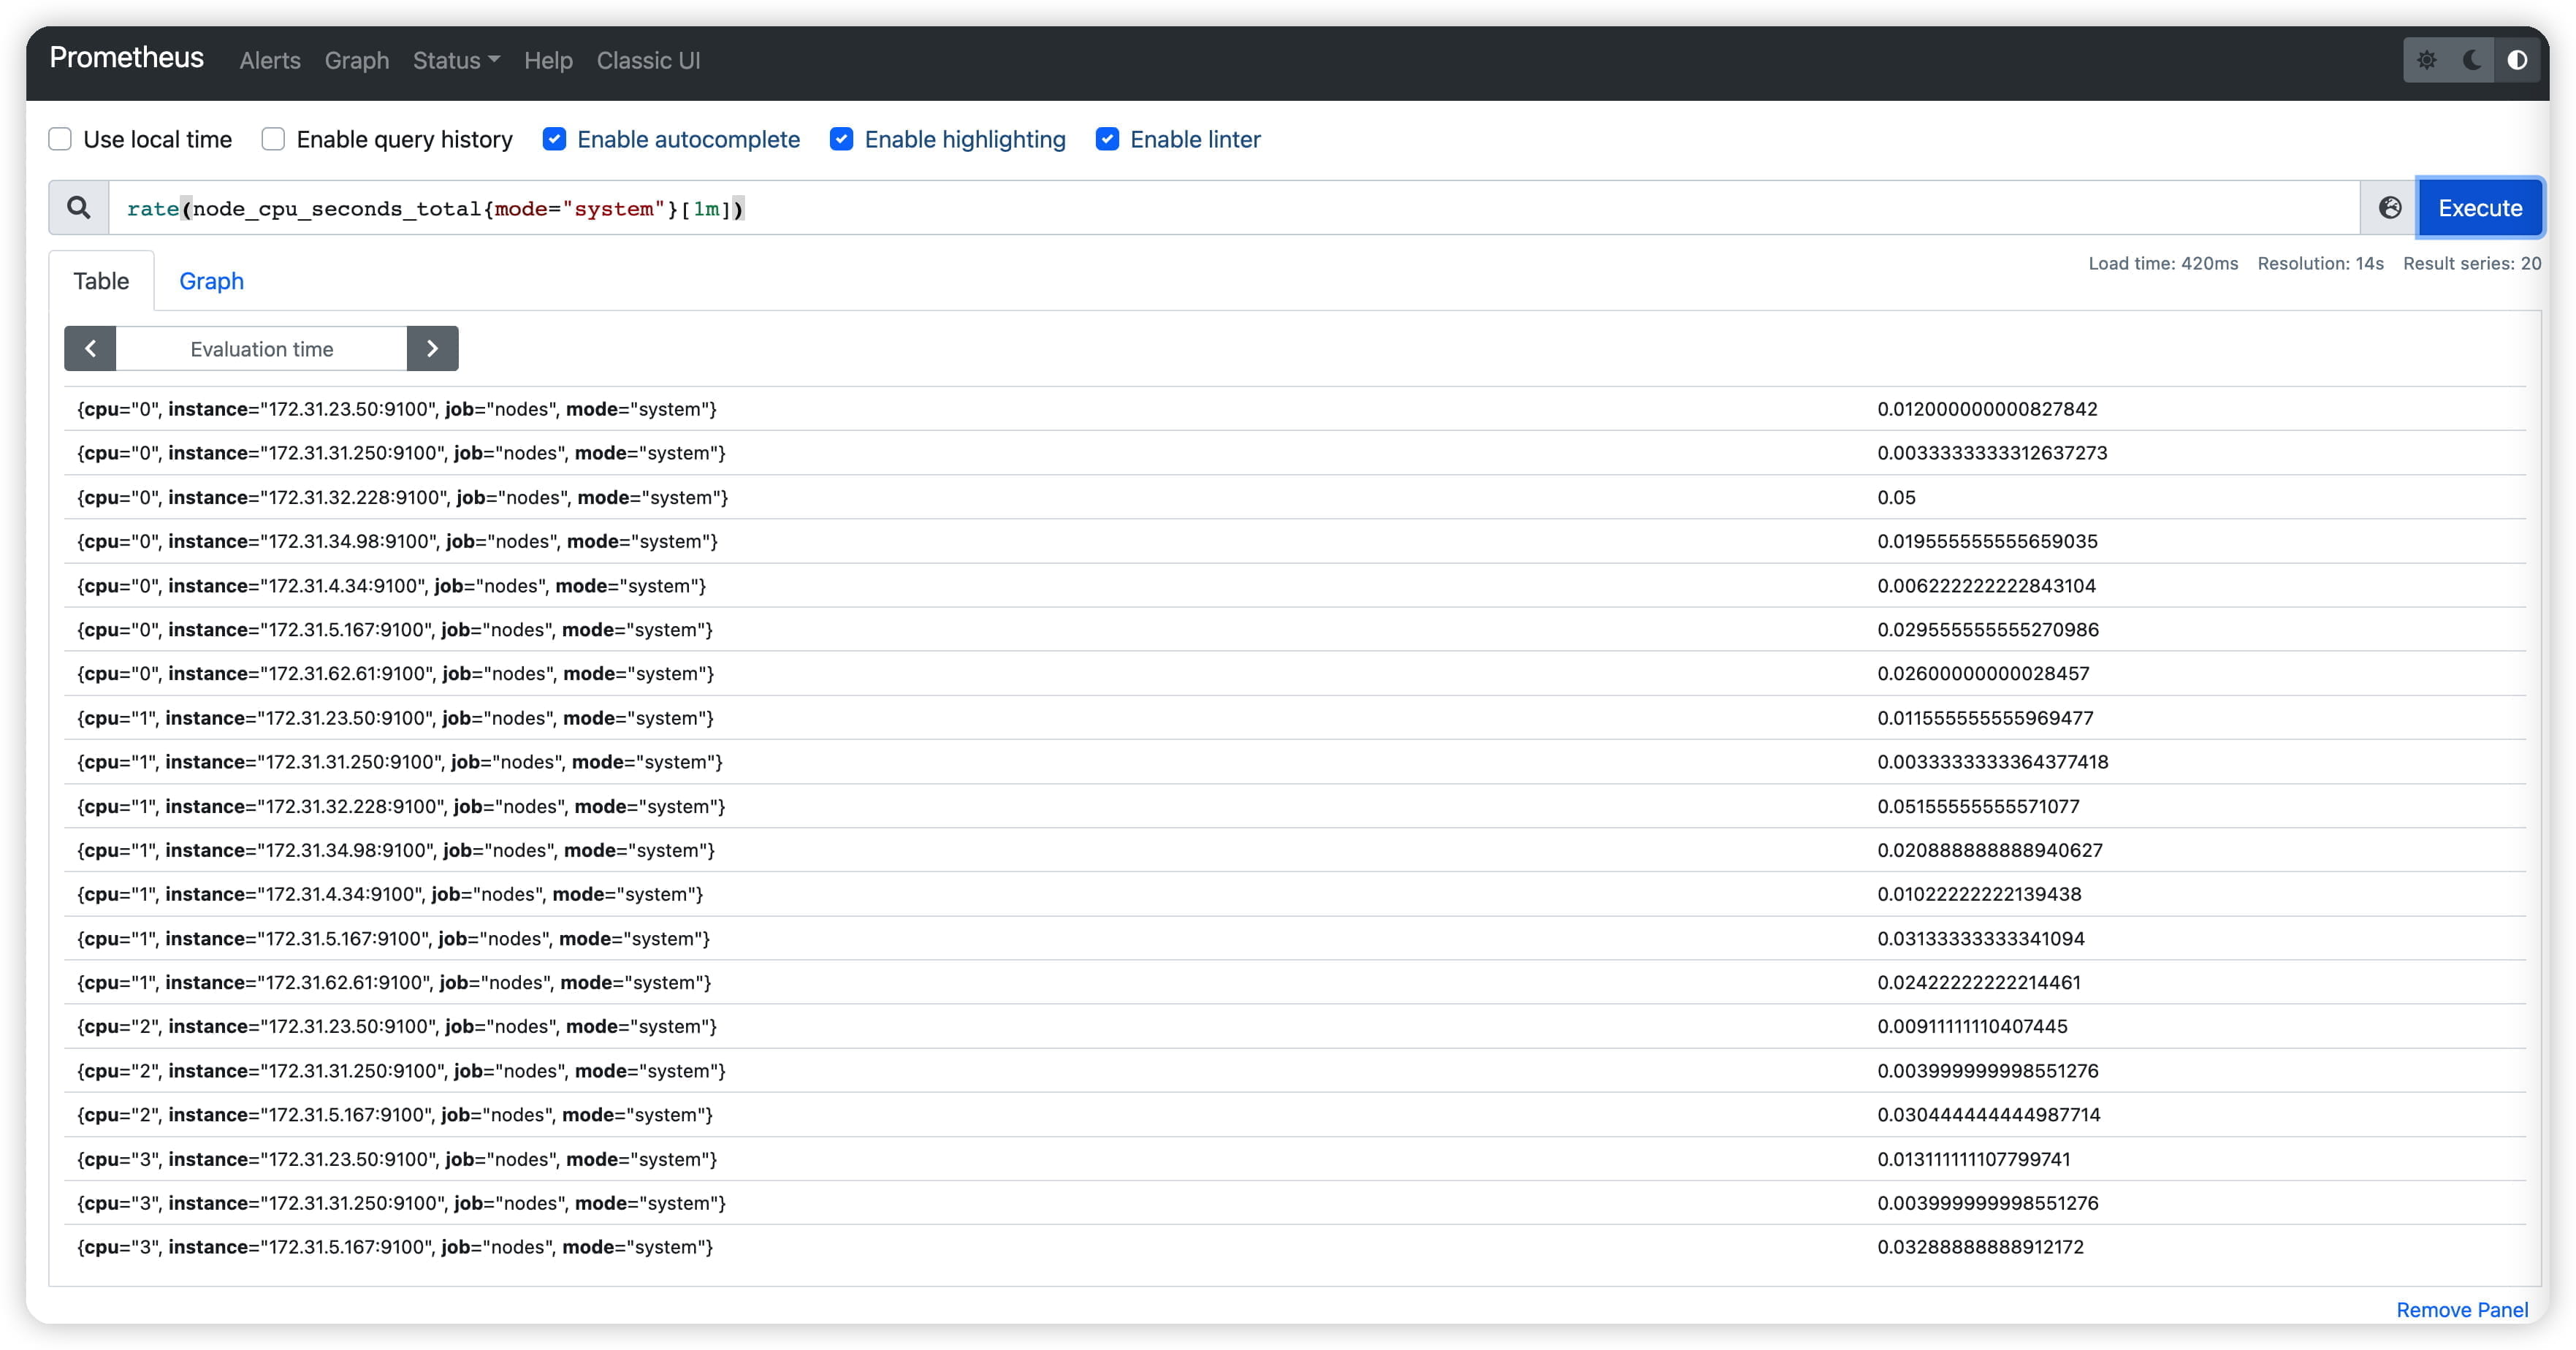
1.2 登录prometheus面板查询

Click on the links below to see some example metrics:

MetricMeaning
rate(node_cpu_seconds_total{mode=”system”}[1m])The average amount of CPU time spent in system mode, per second, over the last minute (in seconds)
node_filesystem_avail_bytesThe filesystem space available to non-root users (in bytes)
rate(node_network_receive_bytes_total[1m\])The average network traffic received, per second, over

image-20220726115047660

1.3 常用查询

  • 硬盘百分比
1
2
3
4
5
6
7
8
9
10
11
12
13
14
15
16
17
18
19
20
21
22
23
24
25
26
27
28
29
30
31
32
33
34
35
36
37
38
39
(node_filesystem_size_bytes{fstype=~"ext.?|xfs"}-node_filesystem_free_bytes{fstype=~"ext.?|xfs"}) *100/(node_filesystem_avail_bytes {fstype=~"ext.?|xfs"}+(node_filesystem_size_bytes{fstype=~"ext.?|xfs"}-node_filesystem_free_bytes{fstype=~"ext.?|xfs"}))


{device="/dev/root", fstype="ext4", instance="172.31.23.50:9100", job="nodes", mountpoint="/"}
78.75283914928764
{device="/dev/root", fstype="ext4", instance="172.31.31.250:9100", job="nodes", mountpoint="/"}
67.58544213895829
{device="/dev/root", fstype="ext4", instance="172.31.32.228:9100", job="nodes", mountpoint="/"}
83.37226643085346
{device="/dev/root", fstype="ext4", instance="172.31.34.98:9100", job="nodes", mountpoint="/"}
59.98458796757968
{device="/dev/root", fstype="ext4", instance="172.31.4.34:9100", job="nodes", mountpoint="/"}
44.50606176808944
{device="/dev/root", fstype="ext4", instance="172.31.5.167:9100", job="nodes", mountpoint="/"}
55.990707884250575
{device="/dev/root", fstype="ext4", instance="172.31.62.61:9100", job="nodes", mountpoint="/"}
59.72077496207543


max((node_filesystem_size_bytes{fstype=~"ext.?|xfs"}-node_filesystem_free_bytes{fstype=~"ext.?|xfs"}) *100/(node_filesystem_avail_bytes {fstype=~"ext.?|xfs"}+(node_filesystem_size_bytes{fstype=~"ext.?|xfs"}-node_filesystem_free_bytes{fstype=~"ext.?|xfs"})))by(instance)


{instance="172.31.23.50:9100"}
78.7537961493076
{instance="172.31.31.250:9100"}
67.58565865534388
{instance="172.31.32.228:9100"}
83.37490113461213
{instance="172.31.34.98:9100"}
59.98515901697431
{instance="172.31.4.34:9100"}
44.50609327426293
{instance="172.31.5.167:9100"}
55.99347648924661
{instance="172.31.62.61:9100"}
59.721523233695976

2. Alertmanager

Alertmanager和Prometheus Server一样均采用Golang实现,并且没有第三方依赖。

2.1 下载安装

https://prometheus.io/download/#alertmanager

1
2
3
4
sudo wget https://github.com/prometheus/alertmanager/releases/download/v0.24.0/alertmanager-0.24.0.linux-amd64.tar.gz

sudo tar zxvf alertmanager-0.24.0.linux-amd64.tar.gz
sudo mv alertmanager-0.24.0.linux-amd64/ /opt/alertmanager

Alertmanager解压后会包含一个默认的alertmanager.yml配置文件,Alertmanager的配置主要包含两个部分:路由(route)以及接收器(receivers)。

所有的告警信息都会从配置中的顶级路由(route)进入路由树,根据路由规则将告警信息发送给相应的接收器。Alermanager会将数据保存到本地中,默认的存储路径为data/

2.2 服务并启动

1
sudo vi /usr/lib/systemd/system/alertmanager.service
1
2
3
4
5
6
7
8
9
10
11
12
13
[Unit]
Description=alertmanager service

[Service]
User=root
WorkingDirectory=/opt/alertmanager
ExecStart=/opt/alertmanager/alertmanager
TimeoutStopSec=10
Restart=on-failure
RestartSec=5

[Install]
WantedBy=multi-user.target
1
2
3
4
5
6
sudo systemctl daemon-reload
sudo systemctl enable alertmanager
sudo systemctl restart alertmanager

sudo systemctl status alertmanager
sudo lsof -i:9093
  • 访问

Alertmanager启动后可以通过9093端口访问。

1
curl http://127.0.0.1:9093

2.3 关联Prometheus

编辑Prometheus配置文件prometheus.yml,并添加以下内容

1
2
3
4
alerting:
alertmanagers:
- static_configs:
- targets: ['localhost:9093']

重启Prometheus服务,成功后,可以从http://192.168.40.98:9090/config 查看alerting配置是否生效。

2.3 Prometheus告警规则

一条告警规则主要由以下几部分组成:

  • alert:告警规则的名称。

  • expr:基于PromQL表达式告警触发条件,用于计算是否有时间序列满足该条件。

  • for:评估等待时间,可选参数。用于表示只有当触发条件持续一段时间后才发送告警。在等待期间新产生告警的状态为pending。

  • labels:自定义标签,允许用户指定要附加到告警上的一组附加标签。

  • annotations:用于指定一组附加信息,比如用于描述告警详细信息的文字等,annotations的内容在告警产生时会一同作为参数发送到Alertmanager。

为了能够让Prometheus能够启用定义的告警规则,我们需要在Prometheus全局配置文件中通过rule_files指定一组告警规则文件的访问路径。

1
2
rule_files:
- /opt/prometheus/rules/*.rules
  • 创建告警

    sudo vi node-export-alert.rules

    1
    2
    3
    4
    5
    6
    7
    8
    9
    10
    11
    12
    13
    14
    15
    16
    17
    18
    19
    20
    21
    22
    23
    24
    25
    26
    27
    28
    29
    30
    31
    32
    33
    34
    35
    36
    37
    38
    39
    40
    41
    42
    43
    44
    45
    46
    47
    48
    49
    50
    51
    52
    53
    54
    55
    56
    57
    58
    59
    60
    groups:
    - name: NodeExportAlert
    rules:
    - alert: DiskUsageAlert
    expr: max((node_filesystem_size_bytes{fstype=~"ext.?|xfs"}-node_filesystem_free_bytes{fstype=~"ext.?|xfs"}) *100/(node_filesystem_avail_bytes {fstype=~"ext.?|xfs"}+(node_filesystem_size_bytes{fstype=~"ext.?|xfs"}-node_filesystem_free_bytes{fstype=~"ext.?|xfs"})))by(instance) > 70
    for: 1m
    labels:
    severity: page
    annotations:
    summary: "Instance {{ $labels.instance }} disk usgae high"
    description: "Disk usage high, above 70% (current value: {{ $value }})"

    - alert: CpuAlert
    expr: (1 - avg(rate(node_cpu_seconds_total{mode="idle"}[1m])) by (instance)) * 100 > 70
    for: 1m
    labels:
    severity: page
    annotations:
    summary: "Instance {{ $labels.instance }} disk usgae high"
    description: "CPU usage high, above 70% (current value: {{ $value }})"

    - alert: MemoryUsageAlert
    expr: (1 - (node_memory_MemAvailable_bytes{} / (node_memory_MemTotal_bytes{})))* 100 > 70
    for: 1m
    labels:
    severity: page
    annotations:
    summary: "Instance {{ $labels.instance }} disk usgae high"
    description: "Memory usage high, above 70% (current value: {{ $value }})"


    - alert: DiskIOAlert
    expr: rate(node_disk_io_time_seconds_total{job='nodes'}[1m]) * 100 > 50
    for: 1m
    labels:
    severity: page
    annotations:
    summary: "Instance {{ $labels.instance }} disk io high"
    description: "Disk io high, current value: {{ $value }})"


    - alert: DiskWriteAlert
    expr: rate(node_disk_written_bytes_total{job='nodes'}[1m])/8/1024/1024 > 10
    for: 1m
    labels:
    severity: page
    annotations:
    summary: "Instance {{ $labels.instance }} Disk write high"
    description: "Disk write high, current value: {{ $value }}) M/s"


    - alert: FileFdAlert
    expr: (node_filefd_allocated{job='nodes'}/node_filefd_maximum{job='nodes'}) *100 > 50
    for: 1m
    labels:
    severity: page
    annotations:
    summary: "Instance {{ $labels.instance }} file fd high"
    description: "File fd high, current value: {{ $value }})"
1
sudo systemctl restart prometheus

重启Prometheus后访问Prometheus UI http://127.0.0.1:9090/rules可以查看当前以加载的规则文件。

image-20220726151420749

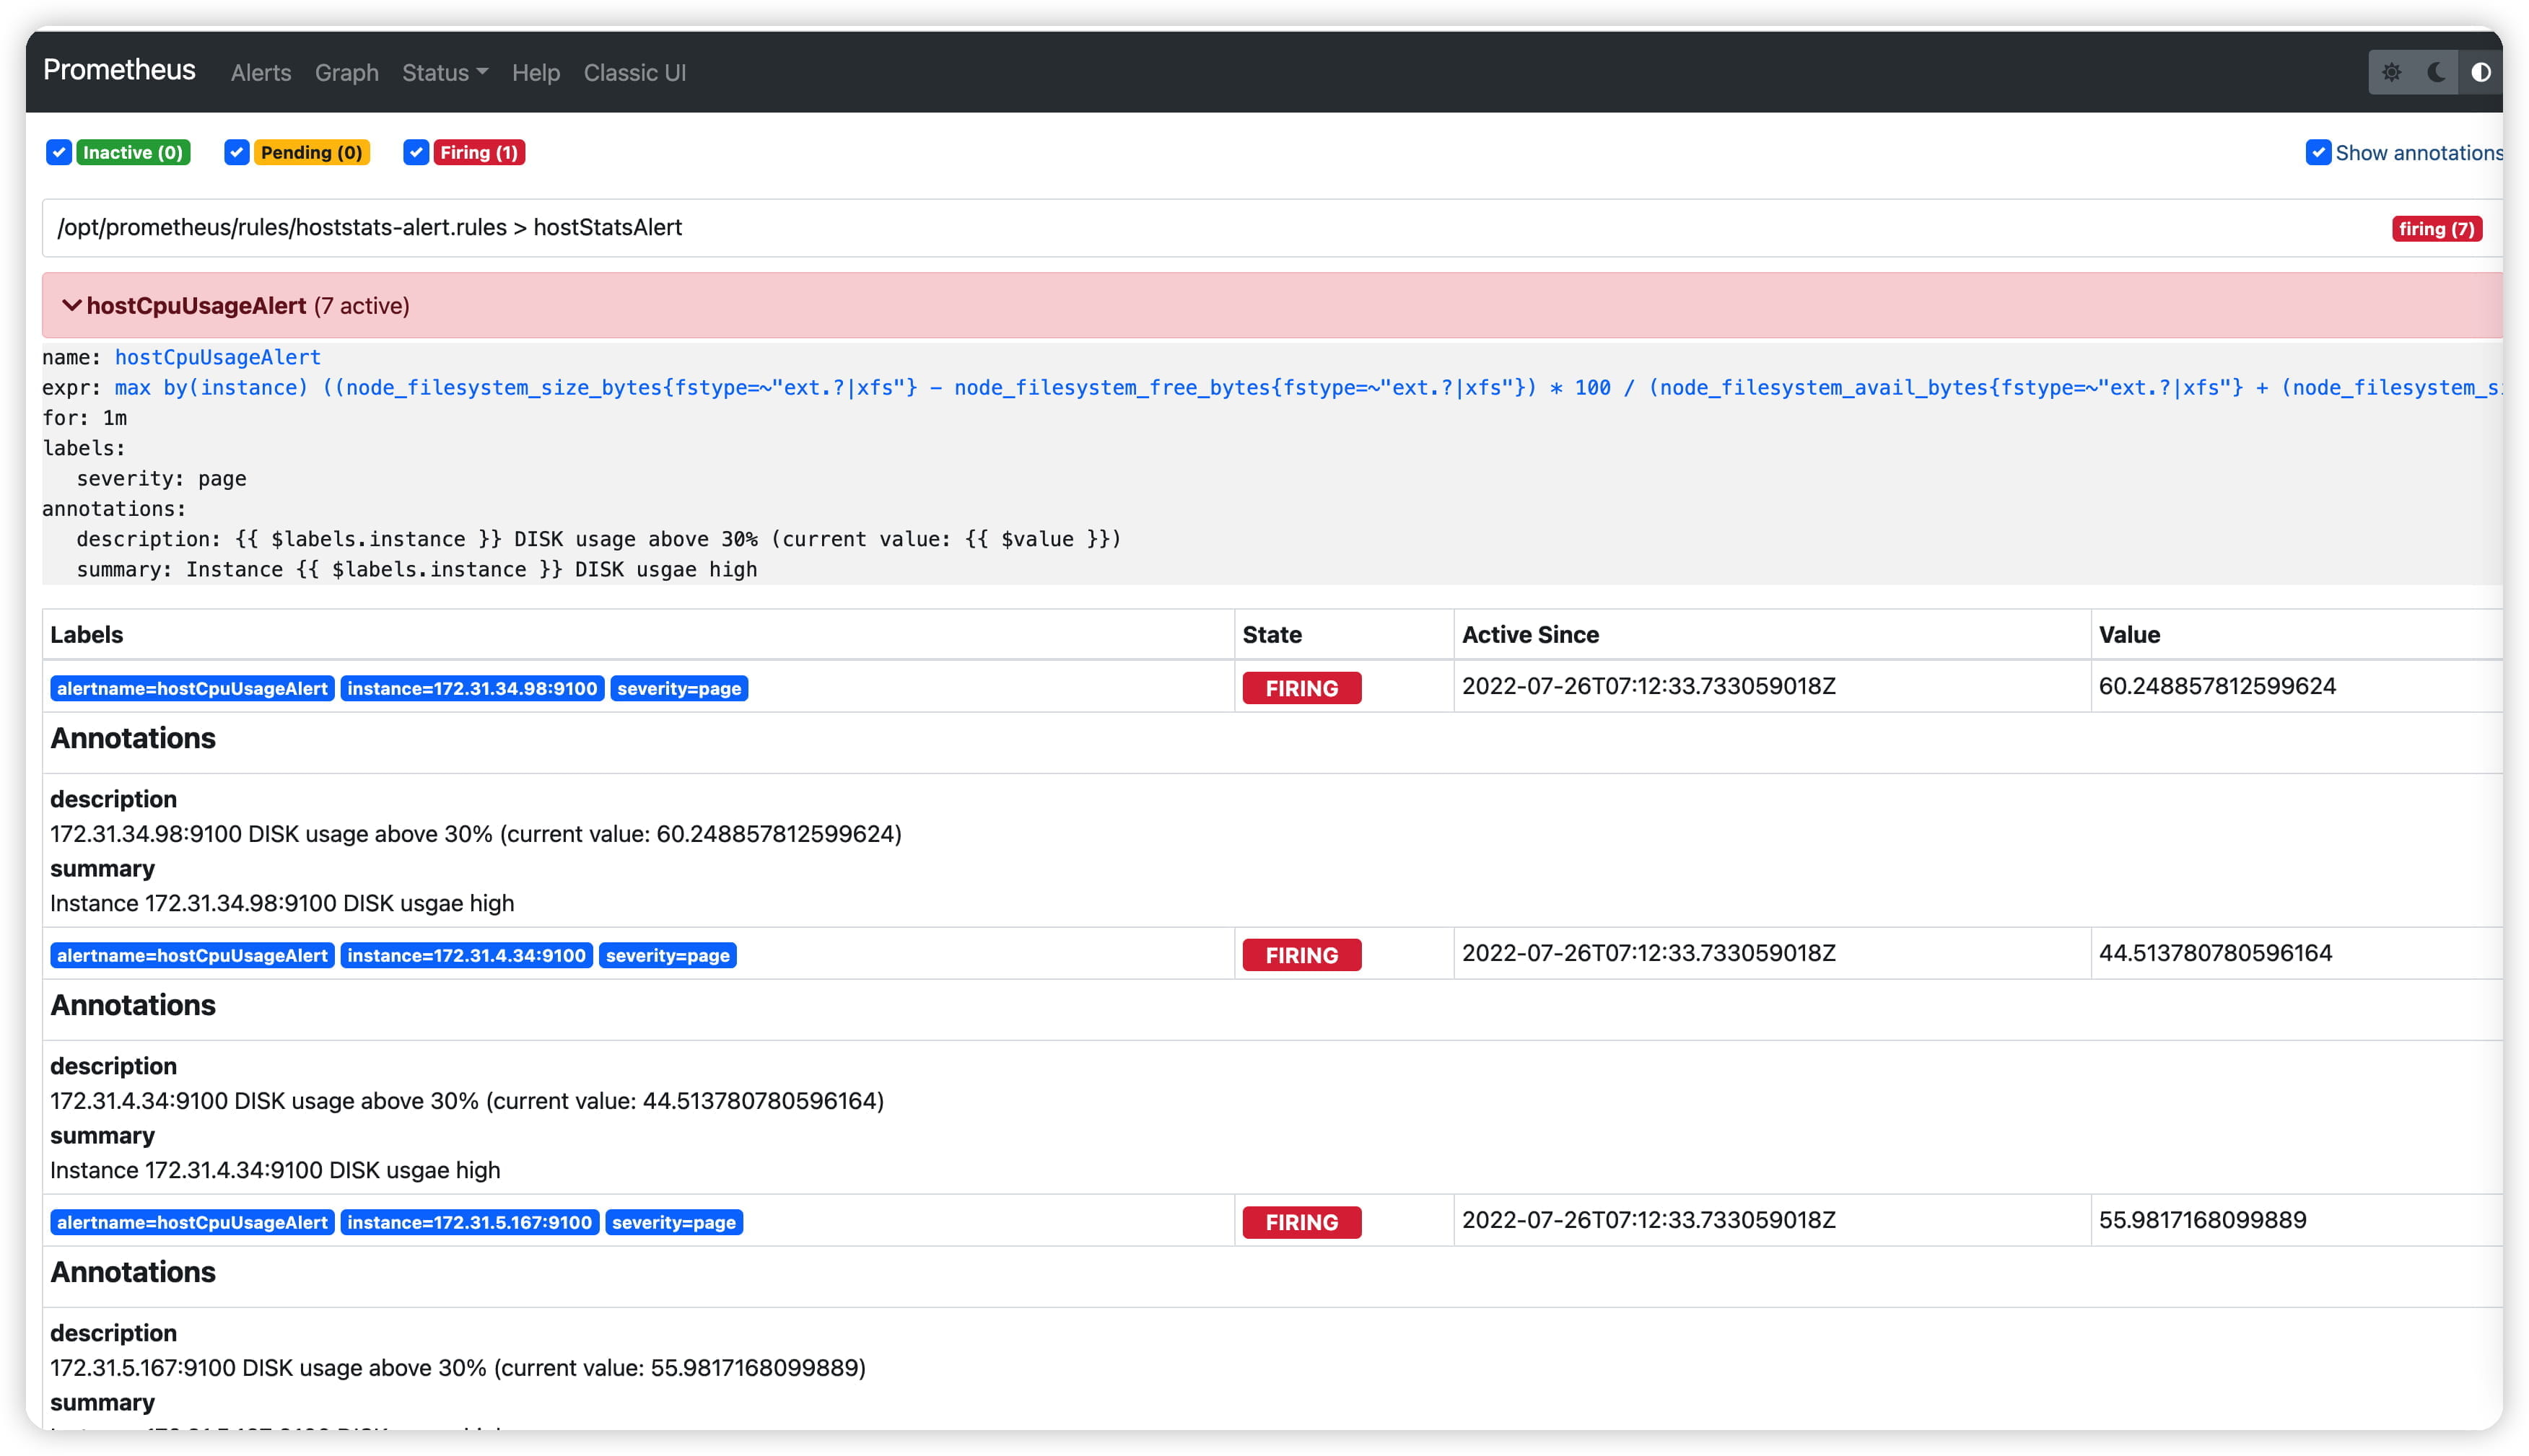
查看Alertmanager UI此时可以看到Alertmanager接收到的告警信息。

image-20220726151737330

3. Alertmanager配置

Alertmanager主要负责对Prometheus产生的告警进行统一处理,因此在Alertmanager配置中一般会包含以下几个主要部分:

  • 全局配置(global):用于定义一些全局的公共参数,如全局的SMTP配置,Slack配置等内容;
  • 模板(templates):用于定义告警通知时的模板,如HTML模板,邮件模板等;
  • 告警路由(route):根据标签匹配,确定当前告警应该如何处理;
  • 接收人(receivers):接收人是一个抽象的概念,它可以是一个邮箱也可以是微信,Slack或者Webhook等,接收人一般配合告警路由使用;
  • 抑制规则(inhibit_rules):合理设置抑制规则可以减少垃圾告警的产生。

在全局配置中需要注意的是resolve_timeout,该参数定义了当Alertmanager持续多长时间未接收到告警后标记告警状态为resolved(已解决)。该参数的定义可能会影响到告警恢复通知的接收时间,读者可根据自己的实际场景进行定义,其默认值为5分钟。

3.1 webhook配置

1
2
cd /opt/alertmanager
vi alertmanager.yml
  • 配置
1
2
3
4
5
6
7
8
9
10
11
12
13
14
15
16
route:
group_by: ['alertname']
group_wait: 30s
group_interval: 5m
repeat_interval: 1h
receiver: 'web.hook'
receivers:
- name: 'web.hook'
webhook_configs:
- url: 'http://127.0.0.1:5001/'
inhibit_rules:
- source_match:
severity: 'critical'
target_match:
severity: 'warning'
equal: ['alertname', 'dev', 'instance']
  • 重启
1
2
sudo systemctl restart prometheus
sudo systemctl restart alertmanager

3.2 webhook代码

1
2
3
4
5
6
7
8
9
10
11
12
13
14
15
16
17
18
19
20
21
22
23
24
25
26
27
28
29
30
31
32
33
34
35
36
37
38
39
40
41
42
43
44
45
46
47
48
49
50
51
52
53
54
55
56
57
58
59
60
61
62
63
64
65
66
67
68
69
70
71
package main

import (
"bytes"
"encoding/json"
"fmt"
"io/ioutil"
"log"
"net/http"
"strings"

"github.com/gin-gonic/gin"
)

var (
HookUrl = "https://open.feishu.cn/open-apis/bot/v2/hook/xxxxxxxxxxx" // test
)

func main() {
router := gin.Default()
router.POST("/webhook", func(c *gin.Context) {
data, _ := ioutil.ReadAll(c.Request.Body)
err := Hook(string(data))
if err != nil {
c.JSON(http.StatusBadRequest, gin.H{"error": err.Error()})
return
}
c.JSON(http.StatusOK, gin.H{"message": " successful receive alert notification message!"})
})
router.Run(":8002")
}

func Hook(data string) (err error) {
log.Println("Hook start, data:", data)

var notification Notification
err = json.Unmarshal([]byte(data), &notification)
if err != nil {
log.Println("Hook Unmarshal err:", err)
return
}

for _, v := range notification.Alerts {
alert, _ := v.Labels["alertname"]
instance, _ := v.Labels["instance"]
des, _ := v.Annotations["description"]
text := TempStr(alert, instance, des)
_ = FeishuAlarmText(text)
}

return
}

func TempStr(alert, instance, des string) string {
temp := `{"config":{"wide_screen_mode":true},"elements":[{"fields":[{"is_short":true,"text":{"content":"{{__alert__}}","tag":"lark_md"}},{"is_short":true,"text":{"content":"{{__instance__}}","tag":"lark_md"}}],"tag":"div"},{"tag":"div","text":{"content":"{{__text__}}","tag":"lark_md"}},{"tag":"hr"},{"elements":[{"content":"[来自 Prometheus](http://prometheus.staff.funlink-tech.com/)","tag":"lark_md"}],"tag":"note"}],"header":{"template":"red","title":{"content":"【Alert 报警】 {{__header__}}","tag":"plain_text"}}}`
str := temp
str = strings.ReplaceAll(str, "{{__header__}}", instance)
str = strings.ReplaceAll(str, "{{__alert__}}", fmt.Sprintf("**类型:** %s", alert))
str = strings.ReplaceAll(str, "{{__instance__}}", fmt.Sprintf("**主机:** [%s](http://grafana.staff.funlink-tech.com/d/9CWBz0bik/fu-wu-qi-xin-xi?orgId=1)", instance))
str = strings.ReplaceAll(str, "{{__text__}}", fmt.Sprintf("**描述:** %s", des))
return fmt.Sprintf("{\"msg_type\":\"interactive\",\"card\":%v}", str)
}

func FeishuAlarmText(text string) (err error) {
_, err = http.Post(HookUrl, "application/json", bytes.NewBufferString(text))
if err != nil {
log.Println("http err:", err)
return
}
return
}

3.3 启动服务

sudo vi /usr/lib/systemd/system/alerthook.service

1
2
3
4
5
6
7
8
9
10
11
12
13
[Unit]
Description=alerthook service

[Service]
User=root
WorkingDirectory=/data/opt/alert-hook
ExecStart=/data/opt/alert-hook/alert-hook
TimeoutStopSec=10
Restart=on-failure
RestartSec=5

[Install]
WantedBy=multi-user.target
  • 操作
1
2
3
4
5
6
sudo systemctl daemon-reload
sudo systemctl enable alerthook
sudo systemctl restart alerthook
sudo systemctl status alerthook

sudo journalctl -u alerthook -f

4. 参考资料

给作者打赏,可以加首页微信,咨询作者相关问题!