pprof排查golang问题
1. quick start
1 | package main |
打开浏览器, 输入 http://localhost:6060/debug/pprof/, 内容显示如下:
1 | /debug/pprof/ |
上面每一个都是一个超链接, 可以点进去, 看到堆栈信息
2. 命令查看
mac需要安装graphviz
1
2brew install graphviz
# 如果一直下载不成功, 修改brew源查看内存使用情况
1
2
3
4
5
6
7
8
9
10
11
12
13
14
15
16
17
18
19
20
21
22
23
24
25
26
27
28
29
30
31
32
33
34
35go tool pprof http://localhost:6060/debug/pprof/heap
# 进入如下gdb交互模式:
# top 查看前10个的内存分配情况
(pprof) top
Showing nodes accounting for 1.16MB, 100% of 1.16MB total
flat flat% sum% cum cum%
1.16MB 100% 100% 1.16MB 100% runtime/pprof.writeGoroutineStacks
0 0% 100% 1.16MB 100% net/http.(*ServeMux).ServeHTTP
0 0% 100% 1.16MB 100% net/http.(*conn).serve
0 0% 100% 1.16MB 100% net/http.HandlerFunc.ServeHTTP
0 0% 100% 1.16MB 100% net/http.serverHandler.ServeHTTP
0 0% 100% 1.16MB 100% net/http/pprof.Index
0 0% 100% 1.16MB 100% net/http/pprof.handler.ServeHTTP
0 0% 100% 1.16MB 100% runtime/pprof.(*Profile).WriteTo
0 0% 100% 1.16MB 100% runtime/pprof.writeGoroutine
# tree 以树状显示
(pprof) tree
Showing nodes accounting for 1.16MB, 100% of 1.16MB total
----------------------------------------------------------+-------------
flat flat% sum% cum cum% calls calls% + context
----------------------------------------------------------+-------------
1.16MB 100% | runtime/pprof.writeGoroutine
1.16MB 100% 100% 1.16MB 100% | runtime/pprof.writeGoroutineStacks
# png 以图片格式输出,在当前目录下
(pprof) png
Generating report in profile001.png
# svg 生成浏览器可以识别的svg文件,在当前目录下, 直接点开在浏览器查看
(pprof) png
Generating report in profile001.png列名 含义 flat 本函数的执行耗时 flat% flat 占 CPU 总时间的比例。程序总耗时 16.22s, Eat 的 16.19s 占了 99.82% sum% 前面每一行的 flat 占比总和 cum 累计量。指该函数加上该函数调用的函数总耗时 cum% cum 占 CPU 总时间的比例
3. 实践
1 | # 下载测试项目 |
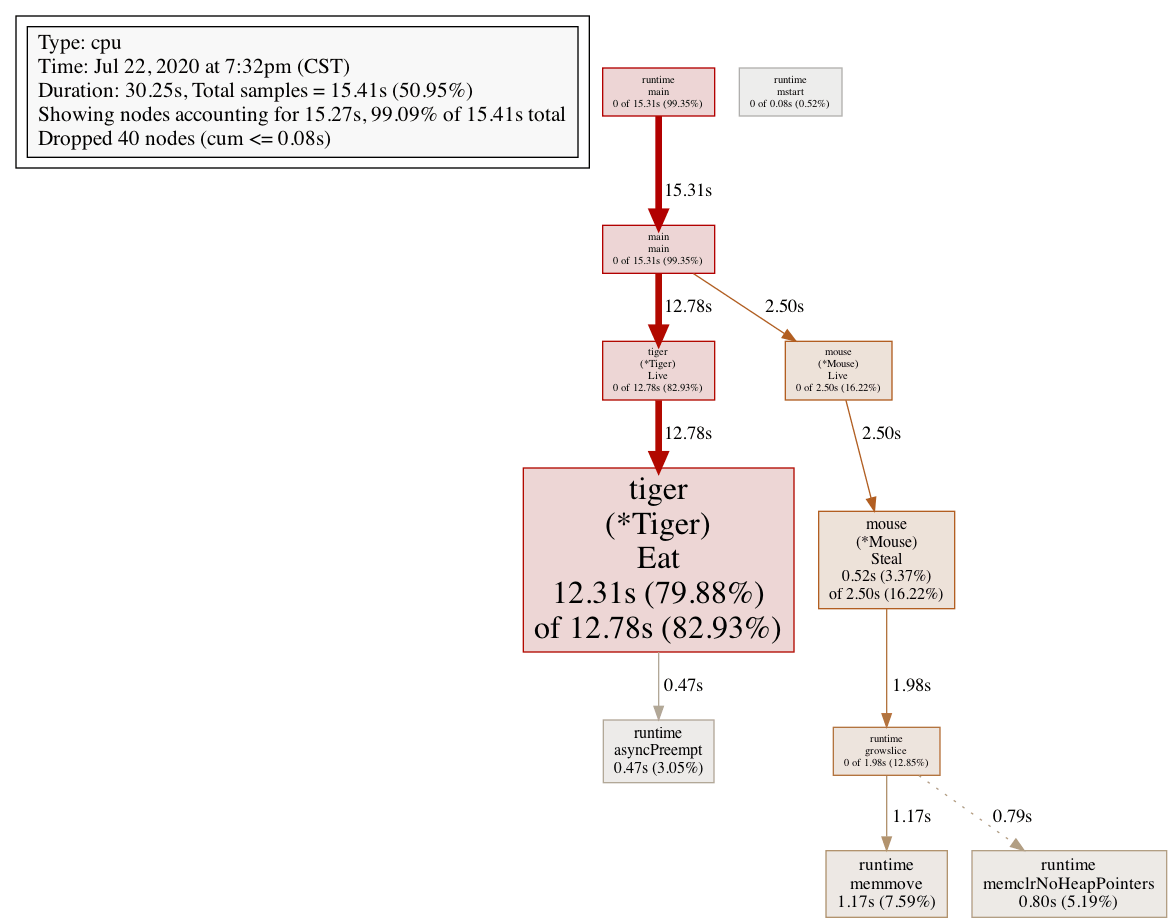
3.1 排查CPU
1 | go tool pprof http://localhost:6060/debug/pprof/profile |
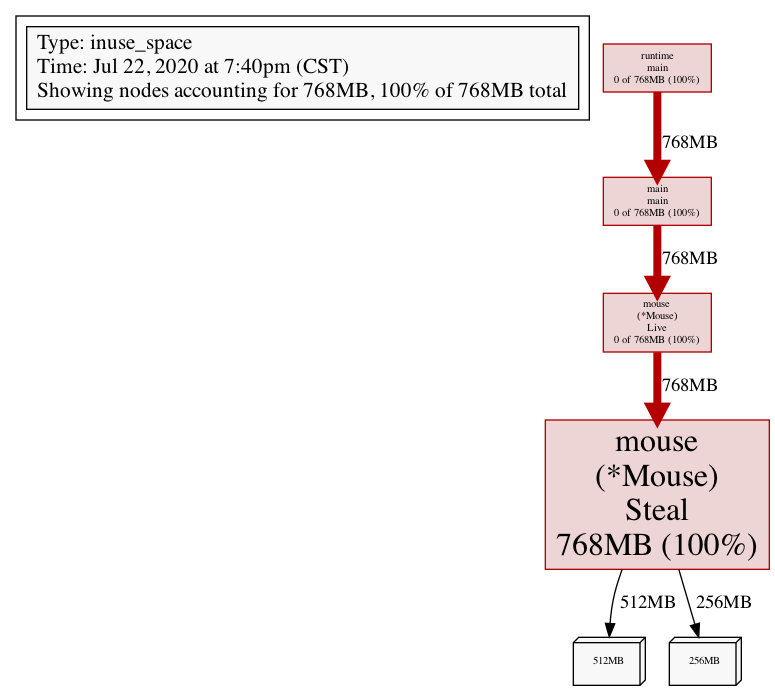
3.2 排查内存
1 | # 把死循环代码注释, 接着测试, 看内存使用, 注意是 heap |
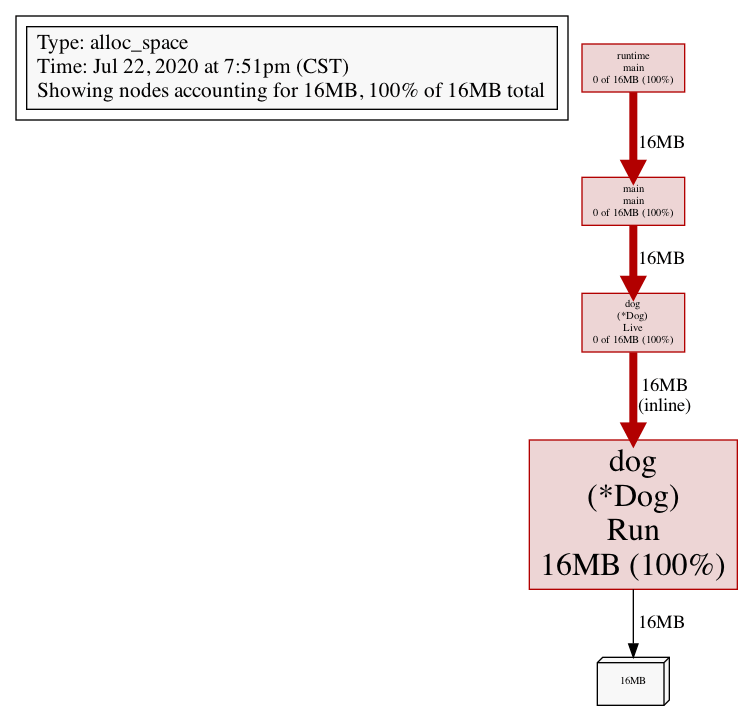
3.3 排查 GC
1 | # 频繁的 GC 对 golang 程序性能的影响也是非常严重的。虽然现在这个程序内存使用量并不高,但这会不会是频繁 GC 之后的假象呢? |
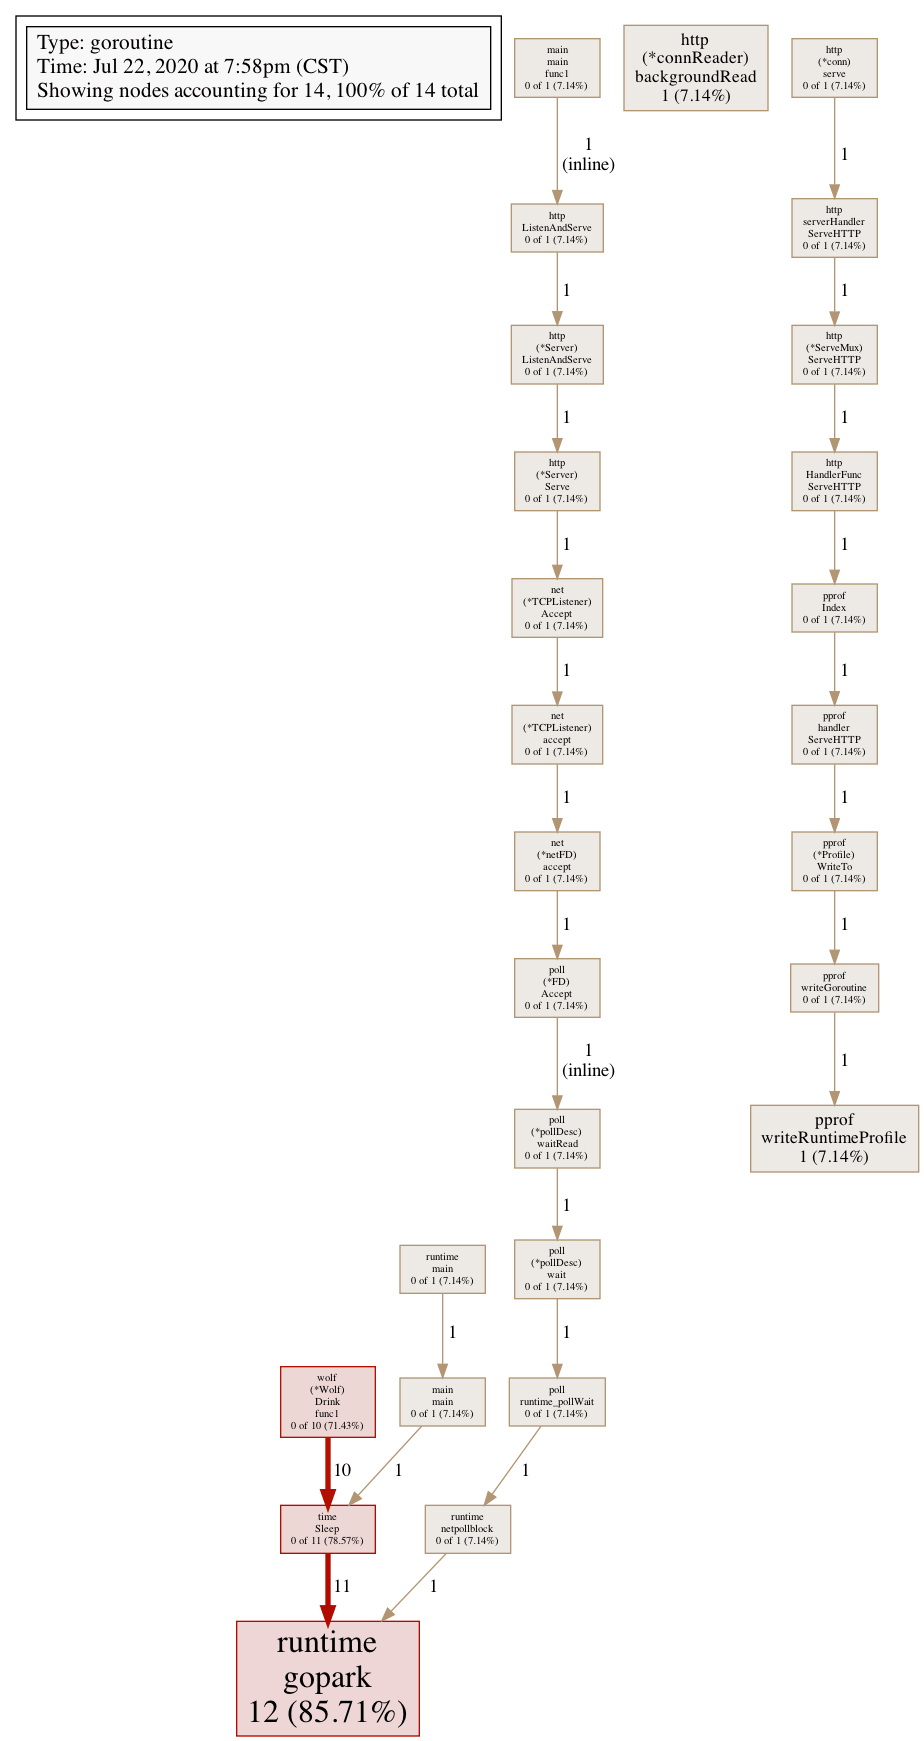
3.4 排查协程泄露
1 | go tool pprof http://localhost:6060/debug/pprof/goroutine |
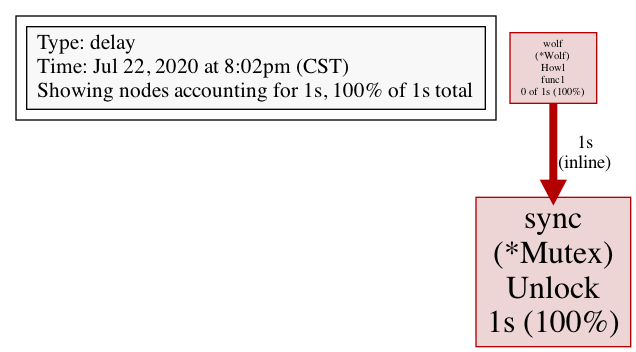
3.5 排查锁的争用
1 | go tool pprof http://localhost:6060/debug/pprof/mutex |
3.6 排查阻塞操作
1 | go tool pprof http://localhost:6060/debug/pprof/block |
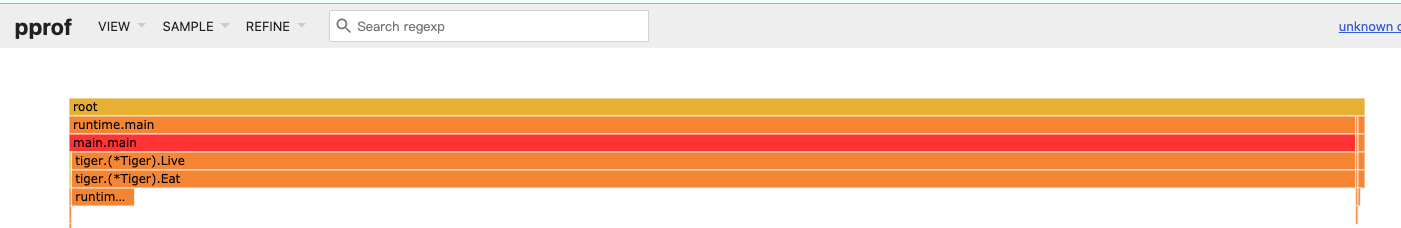
4. 火焰图
1 | # 在上面例子中 |